SNAPshot: January 2026
A Benny Insights Report

Rishi Ahuja
Feb 10, 2026


Executive Summary
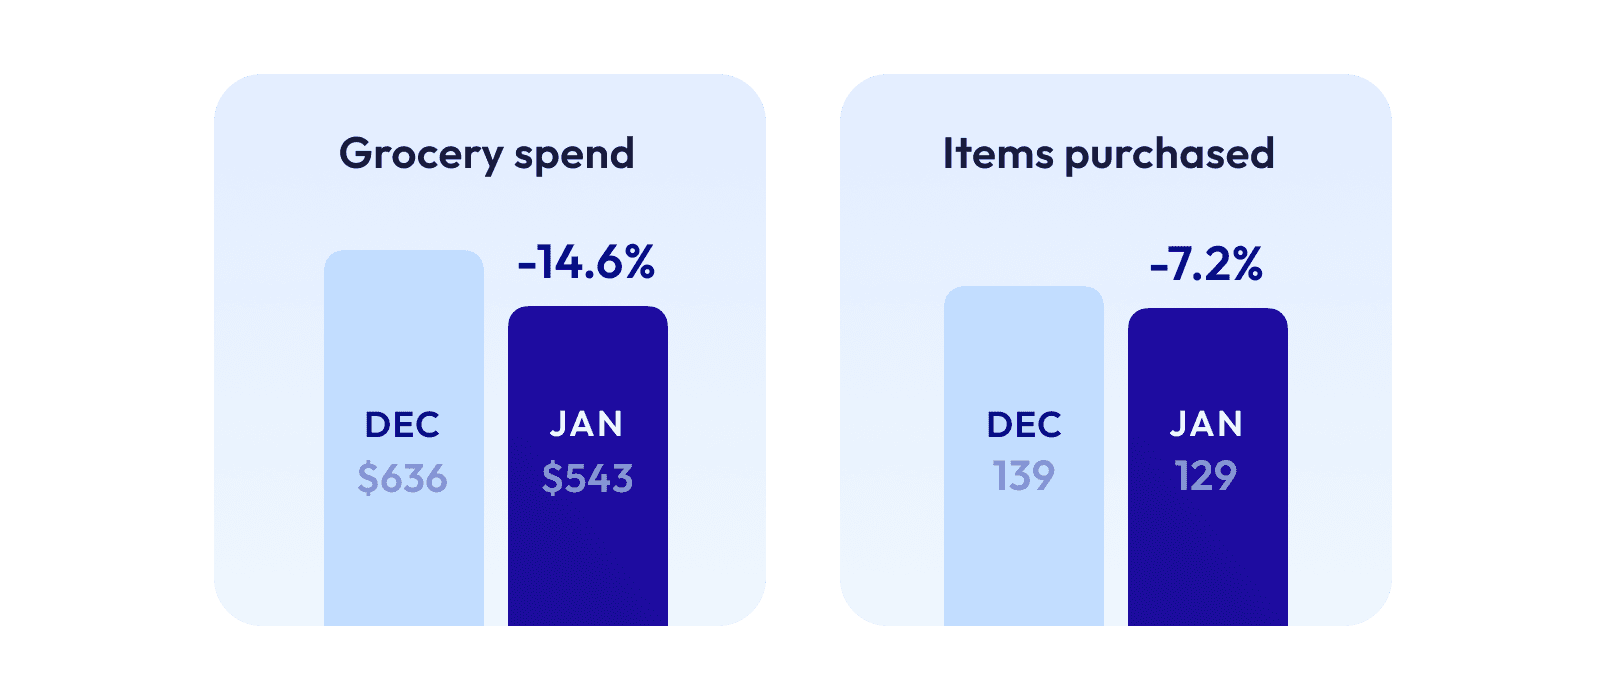
January brought a post-holiday pullback in SNAP household spending on Benny. Total grocery spend per user declined 15%, while items purchased fell 7%, indicating a shift toward lower-cost purchases rather than reduced volume.
Key findings:
Total grocery spend decreased 14.6% month-over-month, consistent with post-holiday normalization patterns seen across retail.
Items purchased fell 7.2%, a smaller decline than spending. The 7-point gap suggests households maintained purchase frequency while shifting category mix.
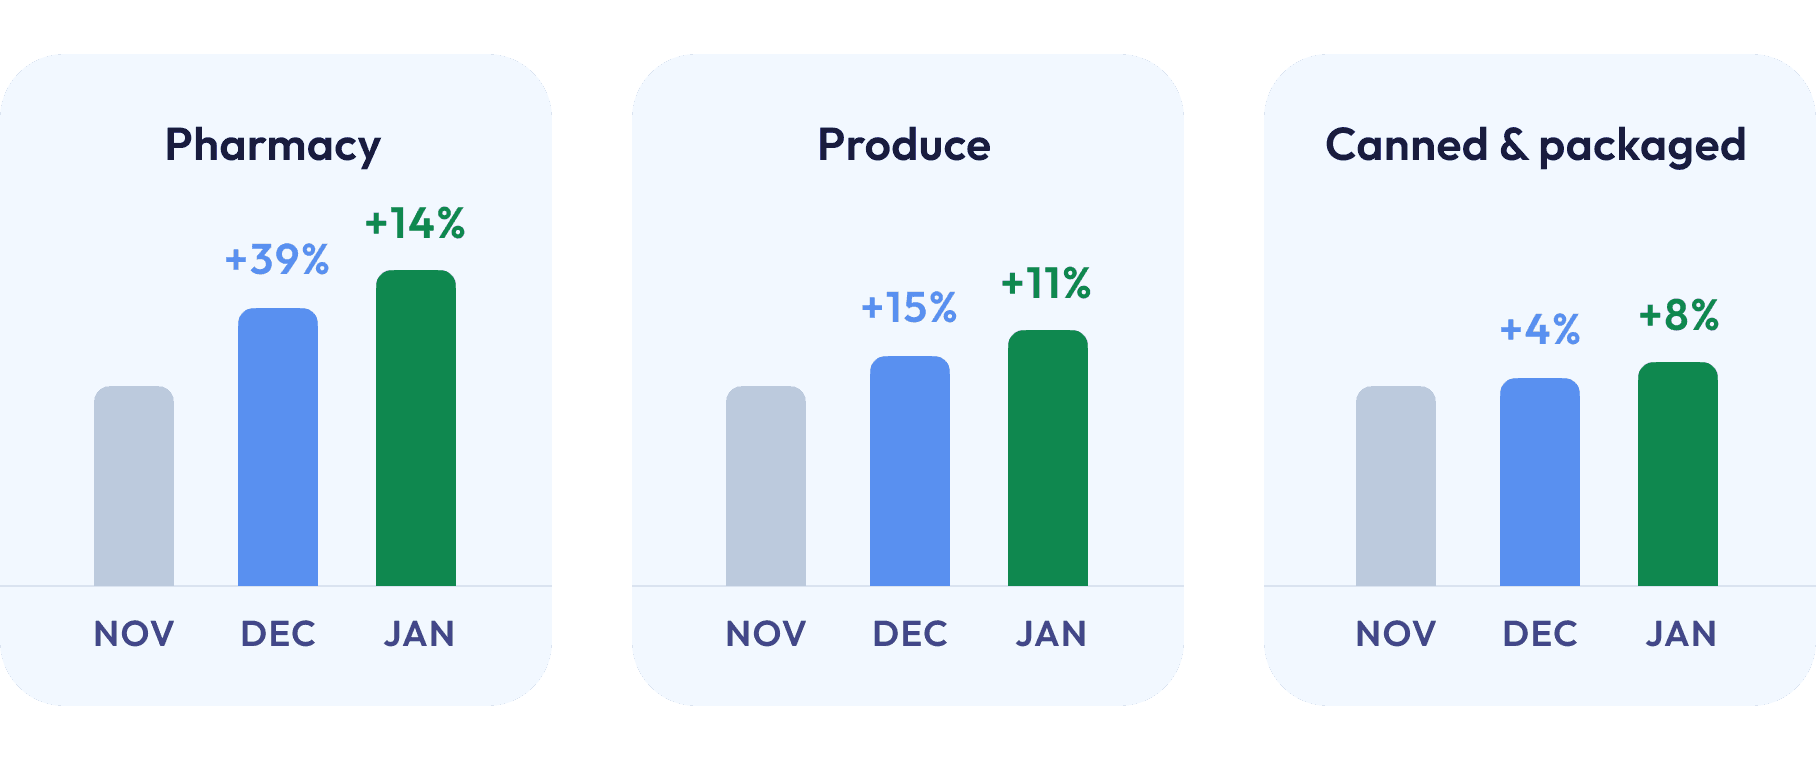
Three categories grew: Vitamins & supplements (+14%), produce (+11%), and canned & packaged foods (+8%) were the only categories to increase from December.
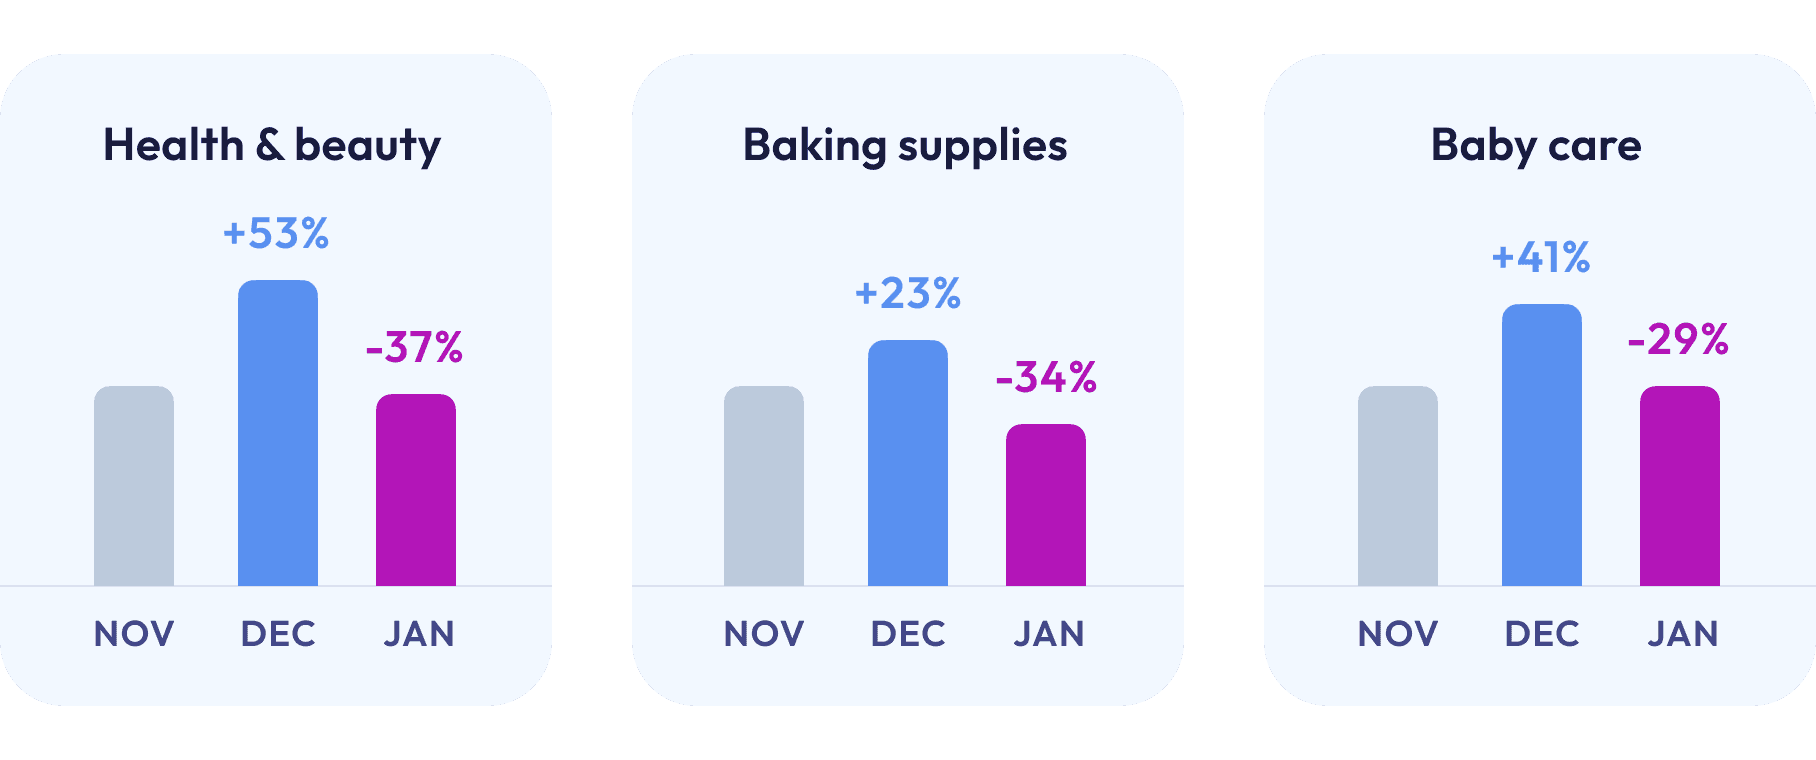
Holiday-driven categories declined sharply: Baking supplies (-34%), health & beauty (-37%), and baby care (-29%) all reversed December's elevated levels.
Core food categories held steady: Meat & seafood (+0.5%), frozen foods (+0.2%), and breakfast foods (-0.2%) saw minimal movement despite overall spending decline.
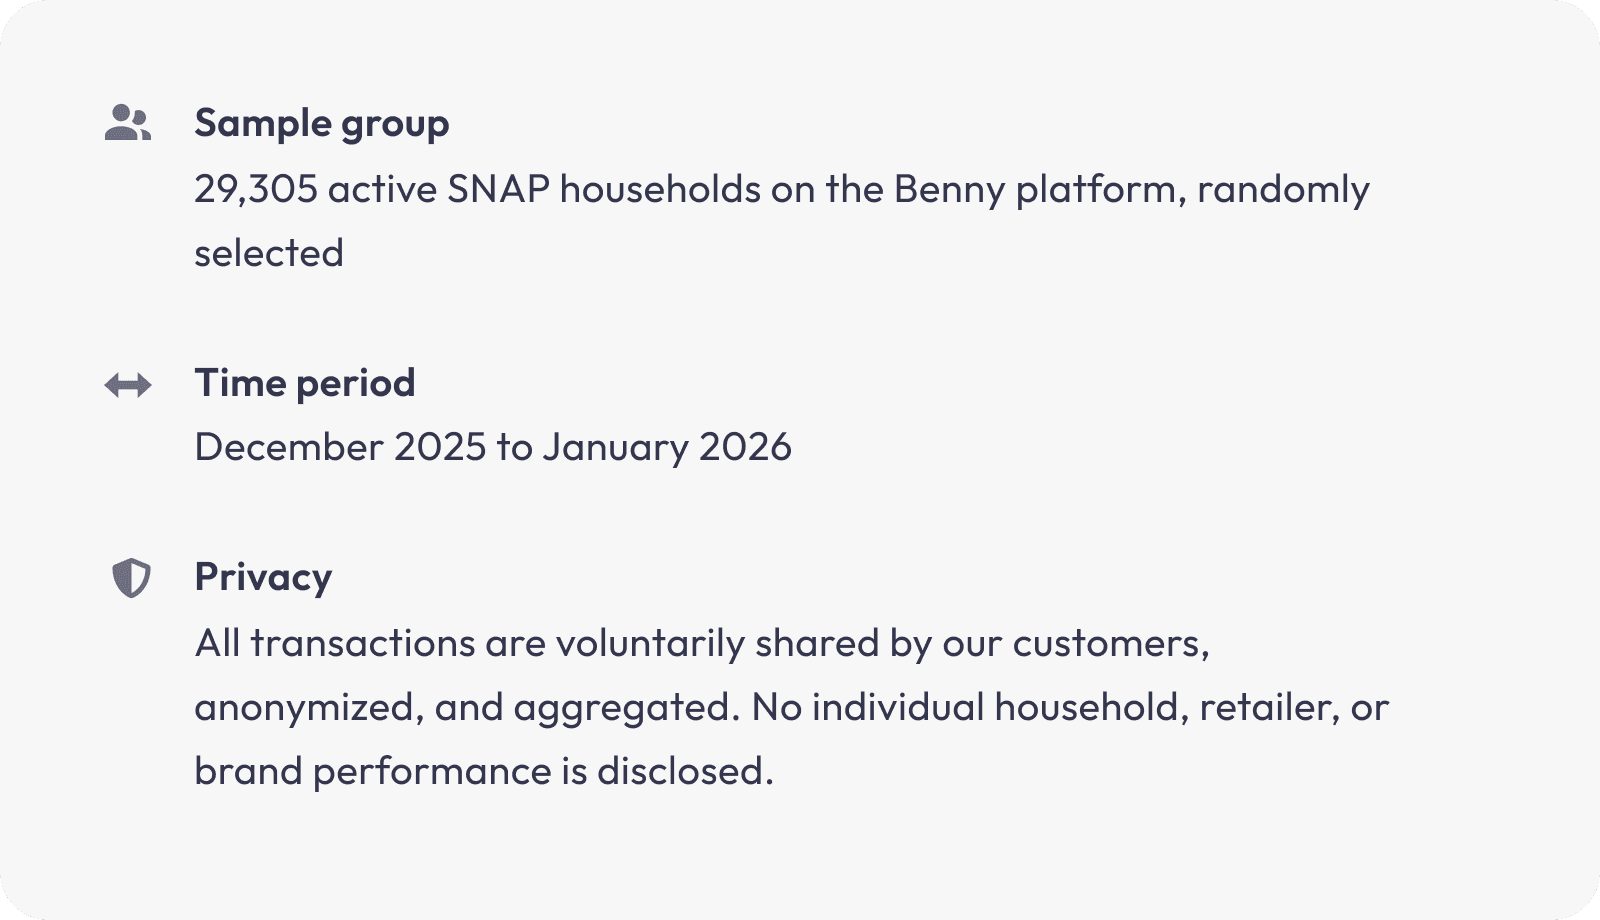
Methodology
Grocery Spend Overview
January per-user metrics returned closer to November 2025 baseline levels after December's seasonal peak.
Metric (per user) | Dec '25 | Jan '26 | MoM change |
|---|---|---|---|
Grocery spend | $636 | $543 | -14.6% |
Items purchased | 139 | 129 | -7.2% |
Category Performance
Category-level data reveals where households cut spending and where they increased it.
Categories That Grew in January
Category | Spend (per user) | MoM change |
|---|---|---|
Vitamins & Supplements | $1.85 | +14.3% |
Produce | $22.00 | +10.7% |
Canned & Packaged Foods | $27.65 | +8.4% |
Condiments & Sauces | $17.23 | +1.5% |
Largest Declines in January
Category | Spend (per user) | MoM change |
|---|---|---|
Health & Beauty | $21.92 | -36.9% |
Baking Supplies | $7.99 | -34.2% |
Baby Care | $6.48 | -29.3% |
Pet Supplies | $11.77 | -17.3% |
Snacks | $47.93 | -16.7% |
Deli & Prepared Foods | $9.63 | -16.4% |
Post-Holiday Category Normalization
The sharpest declines came from categories that spiked in December:
Health & beauty dropped 37% after a 53% December increase
Baking supplies fell 34% after rising 23% in December
Baby care declined 29% following a 41% December surge
Snacks fell 17% after jumping 37% in December. Deli & prepared foods (-16%) and beverages (-6%) also pulled back after December gains of 33% and 23%, respectively.
Meanwhile, three categories increased:
Vitamins & supplements climbed 14% after jumping 39% in December
Produce rose 11% in January following a 15% gain in December
Canned & packaged foods grew 8% after a modest 4% December growth
Core proteins and staples saw minimal change: meat & seafood (+0.5%), frozen foods (+0.2%), spices & seasonings (+0.5%), breakfast foods (-0.2%), and dairy & refrigerated (-2%).
Spend vs. Volume Gap
Items per user declined 7% while spending per user fell 15%, creating an 8-point differential. This pattern—volume declining slower than dollars—typically indicates a shift in product mix rather than reduced shopping frequency.
Households bought 10 fewer items per user on average (129 vs. 139) while spending $93 less ($543 vs. $636). The average per-item spend dropped from $4.57 in December to $4.20 in January.
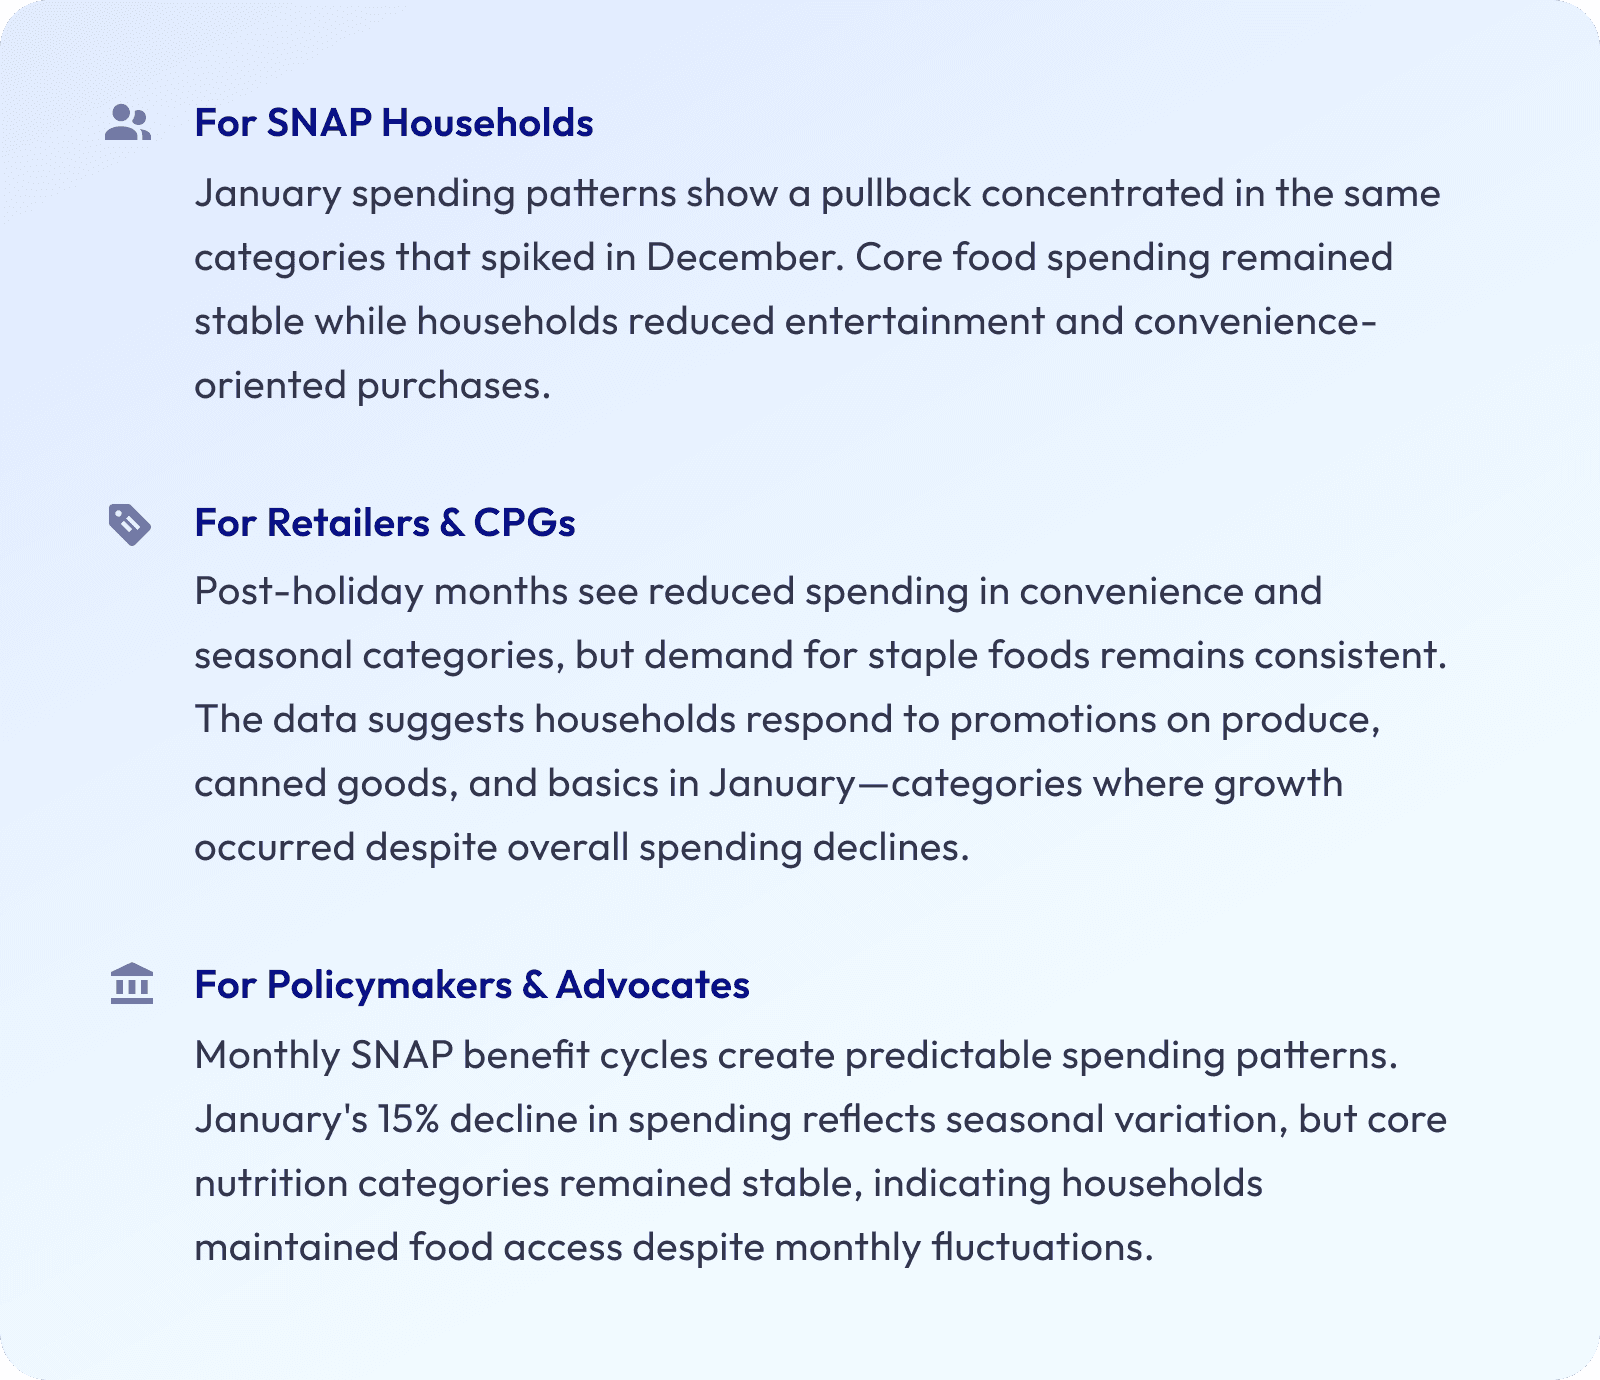
What This Means
Looking Ahead to February
February data will show whether:
Produce and canned foods maintain January's elevated share
Meat and frozen spending increases
The per-item spend gap (Dec: $4.57, Jan: $4.20) narrows or widens
Grow your brand with SNAP shoppers.
Book a call